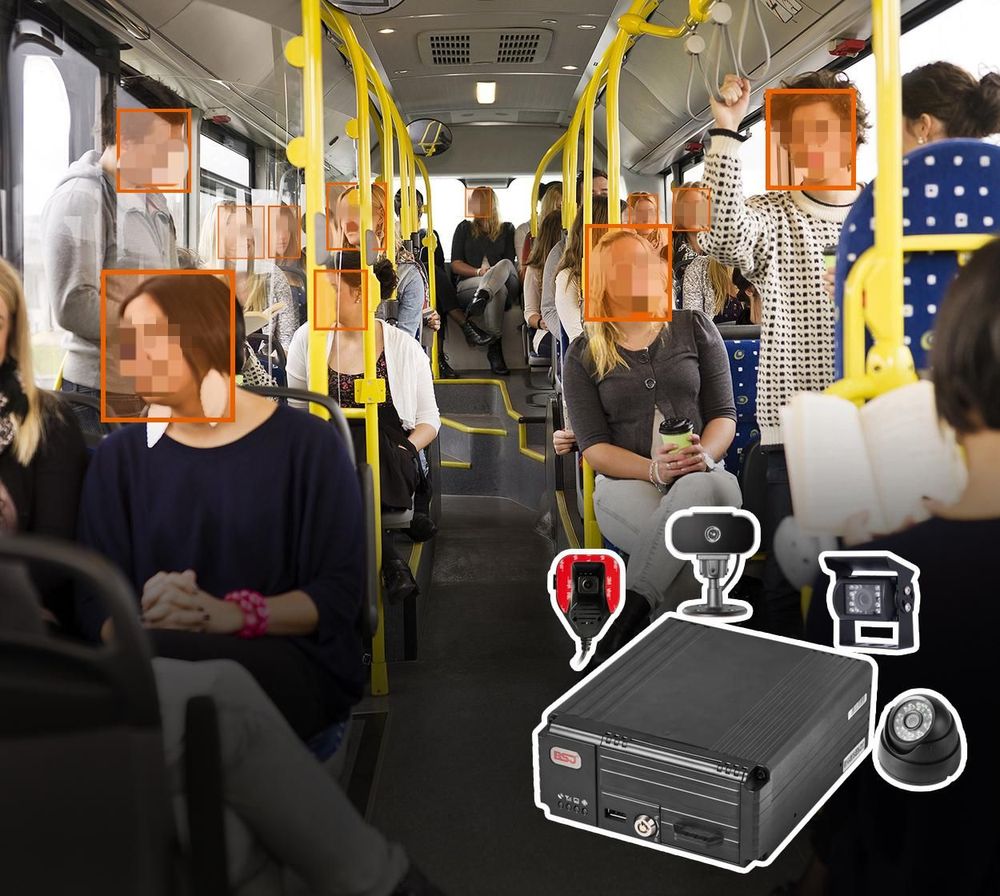
Why this is a real headache
You’re trying to show value from bus fleet management for big diesel rigs and shuttle services, but every number feels fuzzy and everybody wants different things. I’ve seen teams chase fuel savings while maintenance keeps spiking, and nobody trusts the charts. If your goal is a clear smart public transportation system outcome — not just pretty dashboards — you need a problem-first way to measure ROI that actually matches what operations care about.
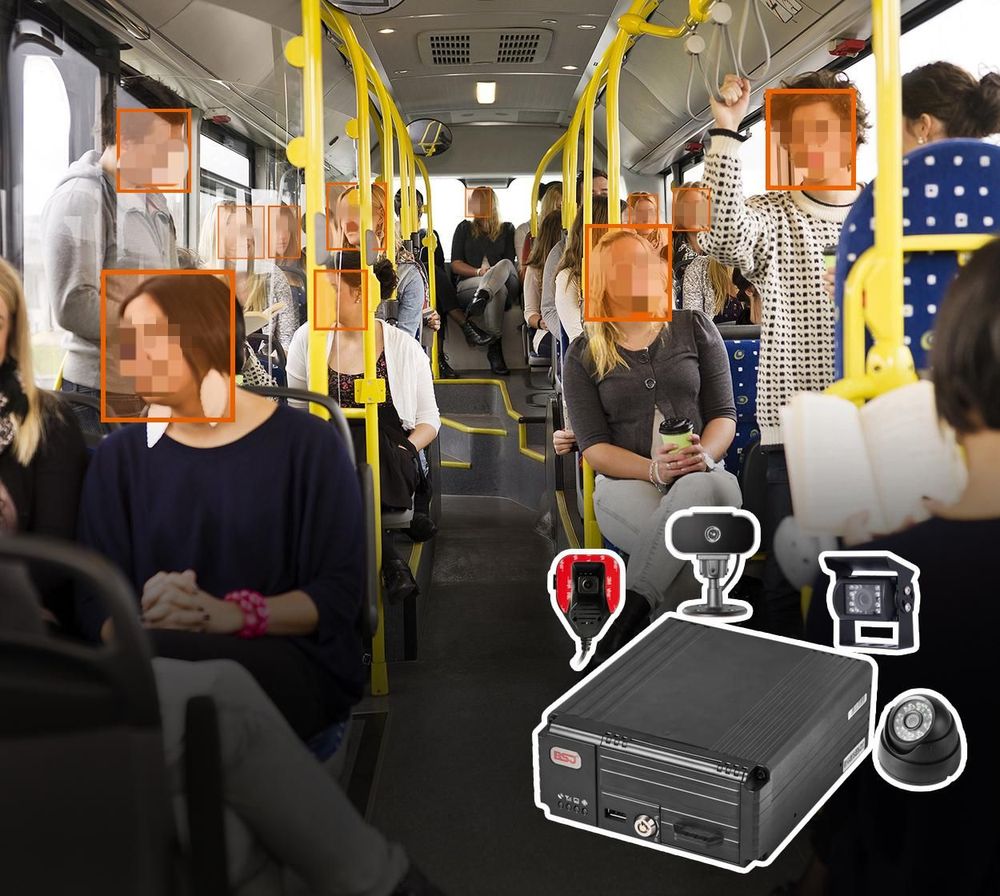
Pin the real problems first
Start by listing the pain that matters. Typical problem statements that actually guide measurement:- Vehicles down during peak shifts cost X in missed revenue and overtime.- Unplanned maintenance eats scheduled crew hours.- Idle time and deadhead runs waste fuel and fleet life.Pick three top operational problems and keep them fixed while you evaluate any tech or process change. Don’t chase every KPI at once; that’s how projects go sideways.
Metrics that actually map to dollars
Use concrete, repeatable metrics you can pull from logs or invoices:- Availability rate: % of fleet fit for service during scheduled hours.- Mean time between failures (MTBF) and mean time to repair (MTTR).- Fuel consumption per service-hour or mile.- Scheduled vs unplanned maintenance cost per vehicle.- Driver hours lost to breakdowns (translate to overtime cost).Each metric converts to cash or operational capacity. Multiply availability improvement by revenue per hour to get a conservative ROI claim.
Step-by-step measurement plan
Follow these steps to keep it honest:1) Baseline for 60–90 days before any change. Capture the metrics above. 2) Run the change (software, sensors, routing tweak) for at least one operating cycle. 3) Compare using same weather/season windows where possible. Adjust for fuel price swings and service demand. 4) Attribute changes carefully: tag which savings came from tech, which from process/training. 5) Project annualized savings only after verifying sustained improvement for two cycles.
Tools and data sources that win
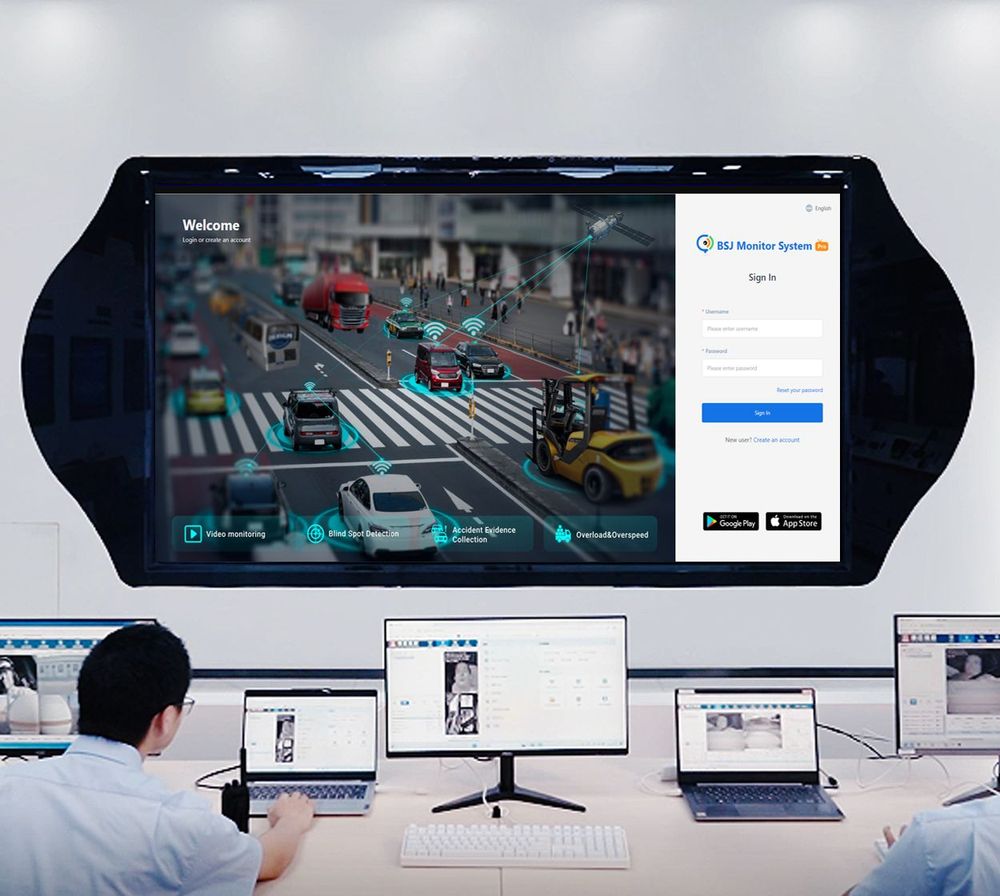
You need clean inputs: telematics for location/speed/idling, maintenance logs with failure codes, fuel cards, and shift rosters. If those are messy, focus first on standardizing data capture — the best algorithm can’t fix garbage inputs. From there, simple dashboards that show trends beat complex models when you need operational buy-in.
Common pitfalls to avoid
Watch out for these traps:- Counting predicted future savings as realized ROI. Don’t. – Mixing one-off capital avoidance (like deferring a purchase) with recurring operational savings. Keep buckets separate. – Letting vendor demos set your metrics; they’ll show the best-case only. – Ignoring human factors: driver behavior and maintenance practices often explain most variance.
Quick comparison of typical approaches
Here’s a straightforward look at common options:- In-house analytics: cheaper, slower setup, better control of assumptions. – Third-party SaaS: fast, standardized KPIs, less tailored to local quirks. – Full systems integrator: higher upfront cost, smoother ops integration, needs clear scope to avoid scope creep. Pick based on which weakness you must fix first — data quality, reporting speed, or operational integration.
Where real-world proof helps
Examples matter. Cities that prioritized operational metrics showed consistent gains; one relevant anchor is Singapore’s Land Transport Authority, which focuses public transit investment on measurable service reliability and passenger outcomes. Use such examples to justify measuring availability and reliability before chasing optimization features.
How to present ROI to skeptical stakeholders
Don’t overwhelm with models. Give them three numbers:- Baseline annual cost tied to the top problem (e.g., downtime cost). – Expected annual change based on observed pilot results. – Time to payback assuming conservative estimates. Show the sensitivity: best, expected, and worst cases. Stakeholders respect honesty and clarity much more than optimistic forecasts.
Alternatives and small bets
If a full roll-out feels risky, test one of these low-friction pilots:- Equip 10 vehicles with telematics and focus on one failure type. – Standardize maintenance codes across depots for 90 days. – Run a scheduling tweak in a single route corridor. Small pilots prove measurement methods and reveal hidden costs before you commit big capital.
Wrap-up that actually helps you decide
Start with problems, measure what converts to money or capacity, run honest pilots, and separate one-off savings from recurring ones. Don’t let tech sell the outcome — let clear baseline and follow-up data do the talking. If you want a partner who focuses on measurable operational gains rather than vague promises, consider how BSJ fits into a plan that keeps problems, metrics, and crew realities front and center.